Using Machine Learning to draw phase diagramms
- Reiter
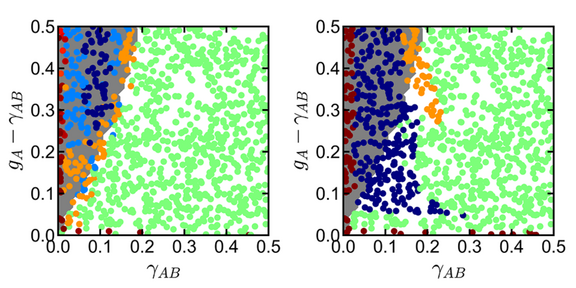
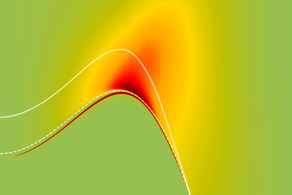
Photonic topological insulator (PTI) lasers have recently attracted lots of interest due to their non-linear nature and their non-hermiticity. Mathematically, the simplest model for a PTI is the Su-Schrieffer-Heeger lattice, which in one dimension gives a topological domain wall. The dynamics at the domain wall can be classified in two lasing modes: an oscillatory and a non-oscillatory one. The occurrences of the modes can be summarized in a phase diagram depending on the model parameters.
In the paper we study, whether we can draw the phase diagram using machine learning techniques without expert knowledge on the system. We use several approaches in feeding the data to the machine learning algorithms: In a top-down approach we merged similar phases in a library, while in a bottom-up approach we constructed the library according to its quality. The best results were obtained for a bottom-up adaptive approach to draw the phase diagram of the Su-Schrieffer-Heeger lattice.
Our work provides now insights into the capabilities of machine learning. While we conclude, that machine learning is able to draw phase diagrams, when fed correctly, we also show the promising potential of machine learning: it might be capable of identifying new phases.
The papers resulted from a collaboration with Stephan Wong and Sang Soon Oh from Cardiff University . Stephan is now PostDoc at Sandia National Laboratories, New Mexico, USA.

